Author: Bao Jeff
Eight pictures to understand the general trend of global population development in 2050.
Total words1492About3Recently, the United Nations Department of Economic and Social Affairs released the 2022 World Population Prospects Report. The report predicts that if the global fertility rate remains at the expected level, the world's population will exceed 9 billion by 2050 and exceed the 10 billion mark by the end of this century.
Global population growth and growth rate decline in 2050
Global population size and annual growth rate from 1950 to 2050
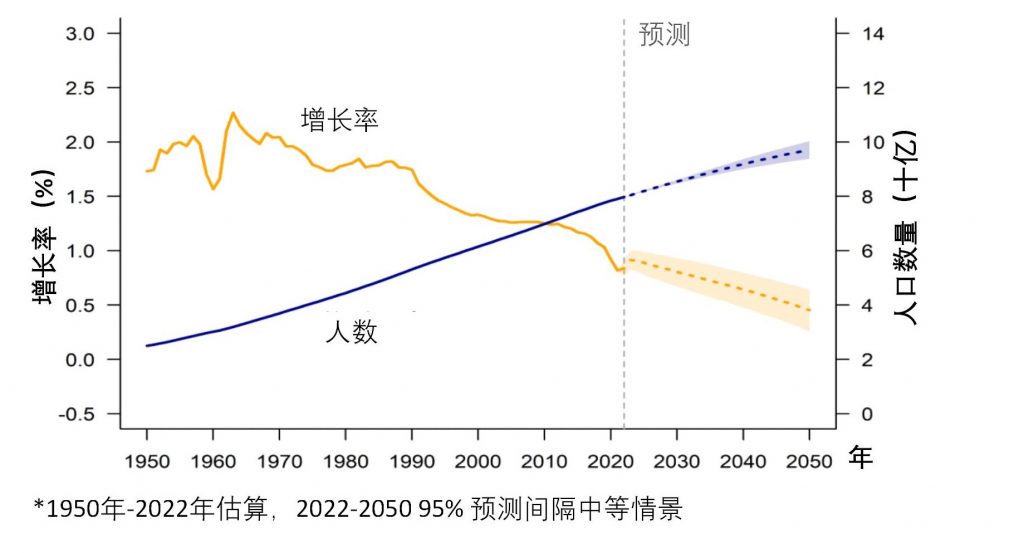
In 2022, the global population will reach 8 billion. By 2080, the global population is expected to peak at approximately 10.4 billion. At the same time, global population growth is expected to continue declining.
Estimated population of global regions from 1950 to 2050
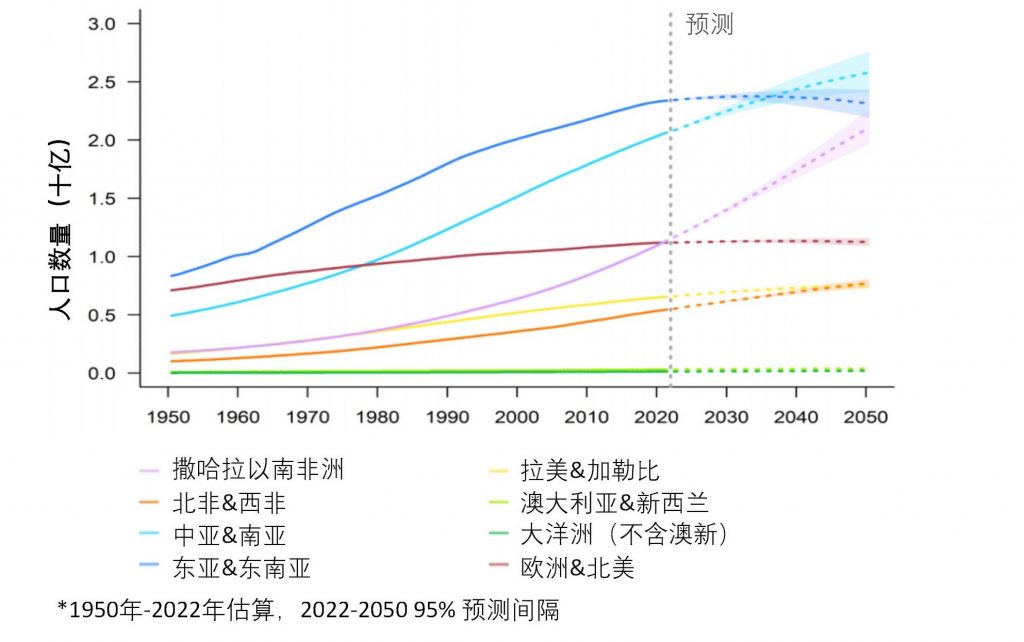
From 2011 to 2022, the global population will increase from 7 billion to 8 billion. Asia contributed to half of the world's population growth, and Africa contributed nearly 400 million. In 2022, East and Southeast Asia, Central Asia, and South Asia will be the most populous regions in the world.
By 2037, Central and South Asia are expected to become the most populous regions in the world. From 2022 to 2050, the population of sub-Saharan Africa will grow at three times the global average rate. By the end of the 2040s, the population of sub-Saharan Africa will exceed 2 billion. Europe and North America are expected to reach population peaks and begin experiencing population declines in the late 2030s.
Comparison of the world's top ten most populous countries in 1990, 2022, and 2050
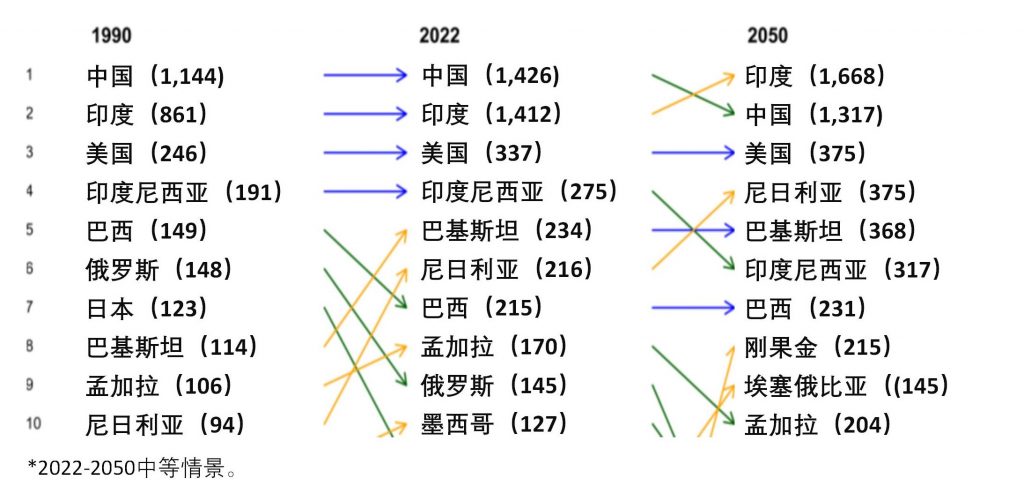
In 2023, India is expected to surpass China and become the world's most populous country. From 2022 to 2050, more than half of the global population growth is expected to be concentrated in eight countries: Congo, Egypt, Ethiopia, India, Nigeria, Pakistan, Philippines and Tanzania.
Global life expectancy has increased significantly, with obvious differences in different countries
Global life expectancy and death toll from 1950 to 2050
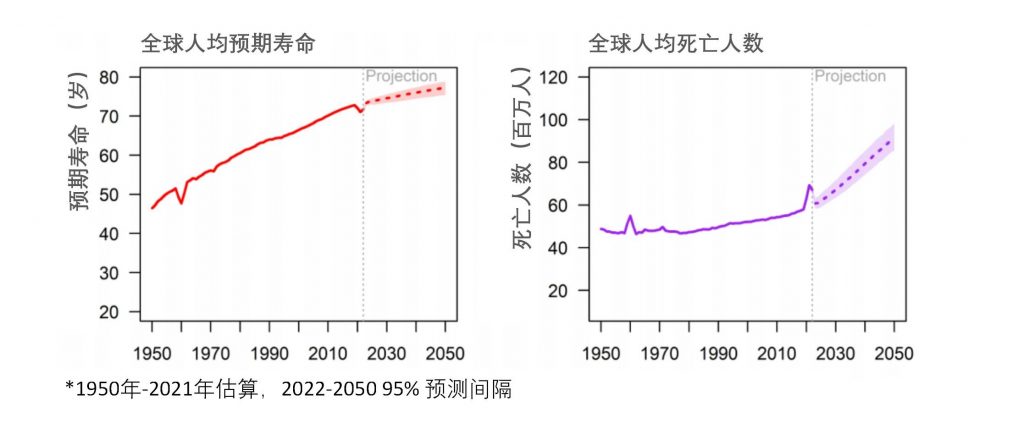
In 2019, the global average life expectancy reached 72.8 years, nearly 9 years higher than in 1990. In 2050, global life expectancy is expected to reach 77.2 years. From 2022 to 2050, the proportion of the global population aged 65 and over in the total population is expected to increase from 10% to 16%.
Average life expectancy by region in the world from 1950 to 2050
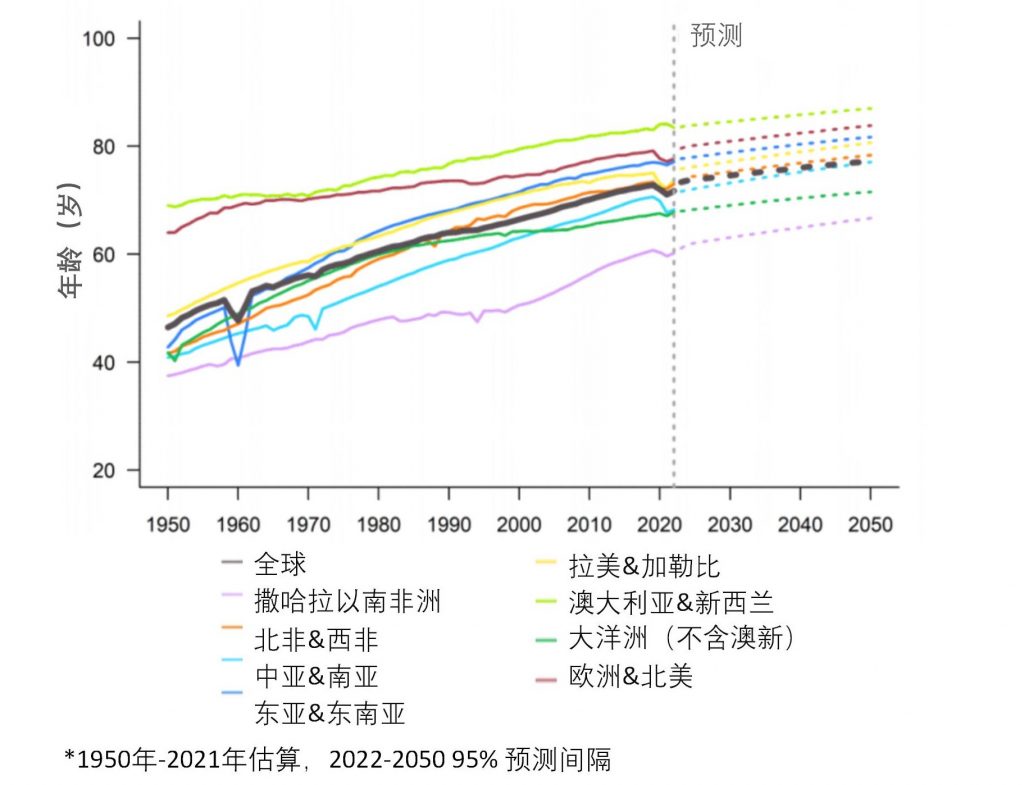
In 2021, the average life expectancy in the least developed countries lags seven years behind the global average. The gap between the country with the highest life expectancy and the country with the lowest is 33.4 years. By 2050, the global average life expectancy is expected to reach 77.2 years, and the gap between the countries with the highest life expectancy and the countries with the lowest is expected to be 31.8 years.
The global total fertility rate has dropped significantly, with large differences in different regions
Global total fertility rate and number of newborns from 1950 to 2050
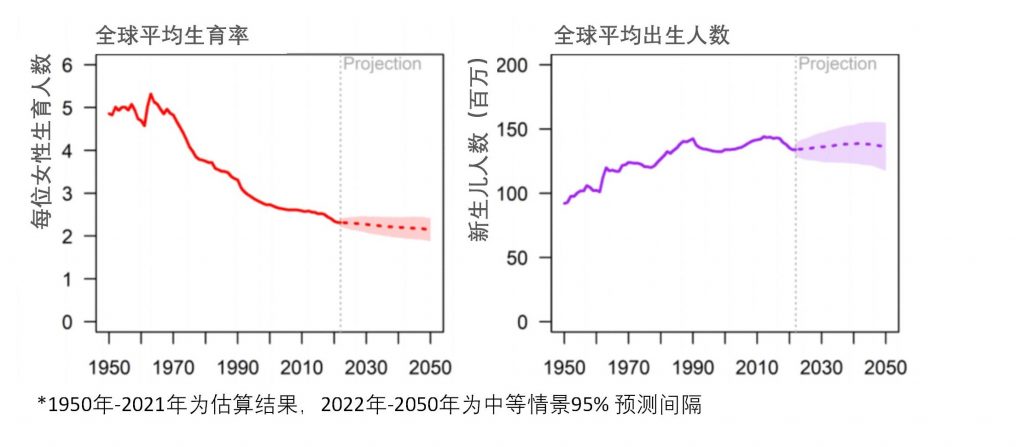
In 2021, the average fertility rate of the global population is 2.3, that is, each woman will give birth to an average of 2.3 children in her lifetime. In 1950, the global average fertility rate was 5. The report predicts that by 2050, the global average fertility rate will further decline to 2.1.
In the late 1980s, nearly 140 million people were born every year in the world. In 2021, 134 million babies will be born around the world. From 2040 to 2045, the number of newborns worldwide is expected to reach 138 million per year. In 2050, the number of newborns worldwide is expected to be between 118 million and 155 million.
Total fertility rate and number of newborns by region in the world from 1950 to 2050
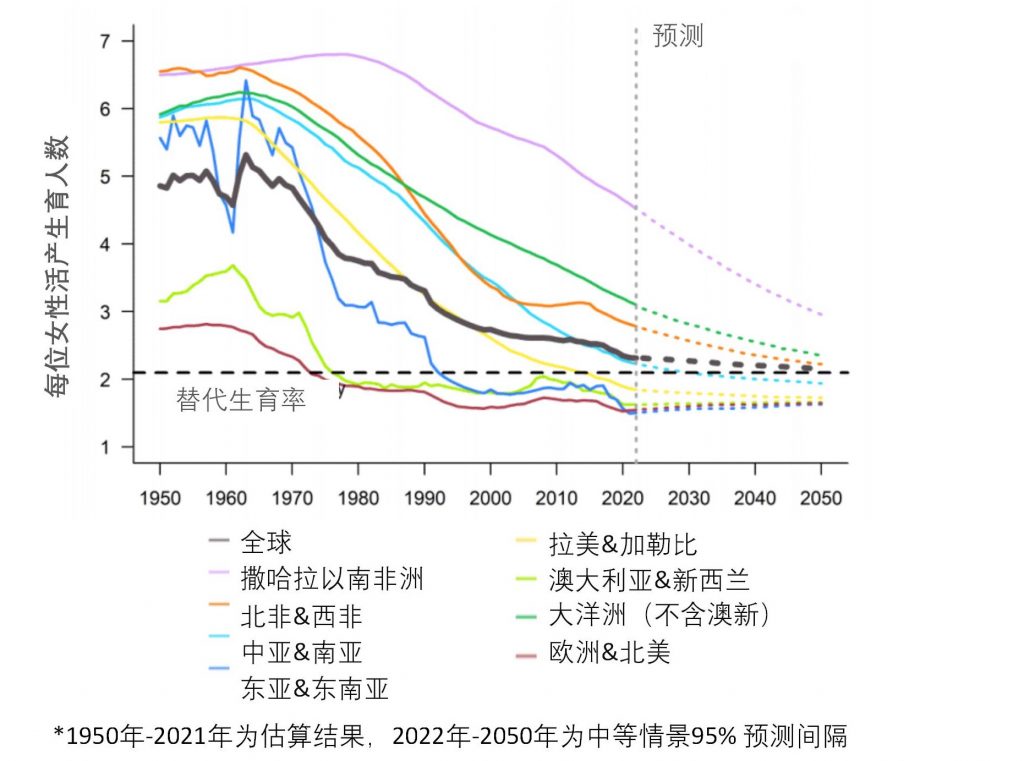
In 2021, most of the world's newborns were born in Central and South Asia (28%), East and Southeast Asia (18%), and Sub-Saharan Africa (29%). In 2021, sub-Saharan Africa led the world in fertility rate with 4.6 children per woman. Fertility rates in Oceania (excluding Australia and New Zealand), North Africa and Western Asia, as well as Central and South Asia, are higher than the world average. Elsewhere, the total fertility rate has fallen to less than 2 children per woman.
The impact of births, deaths, and immigration on the total population of different countries from 1950 to 2050
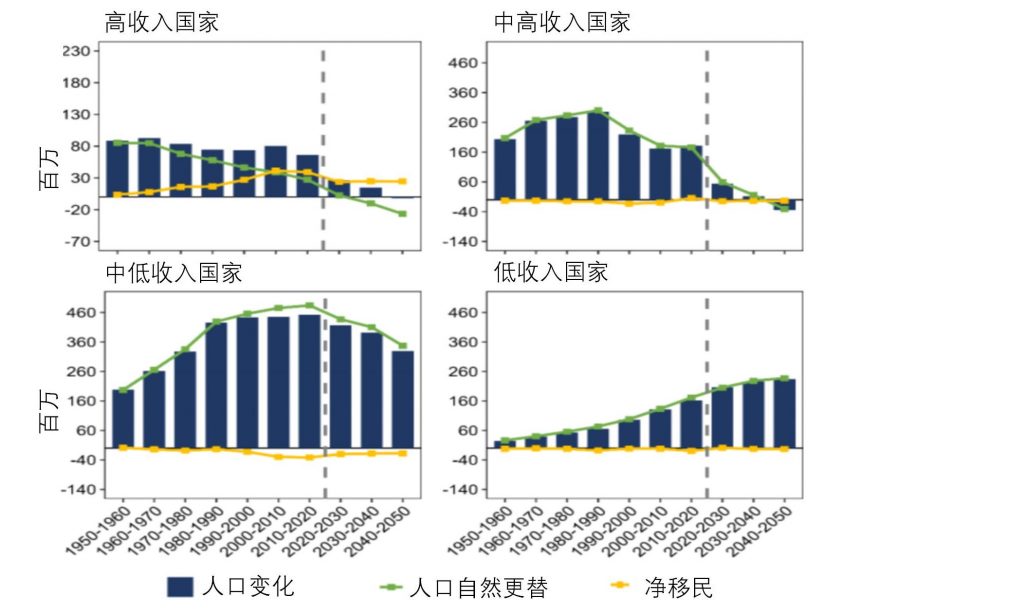
In 2010, 10 countries had a net outflow of more than 1 million immigrants. Among them, temporary labor migration in countries such as Pakistan, India, and Bangladesh has caused population outflow. The population exodus from countries such as Syria, Venezuela Bolivar, and Myanmar is due to insecurity and conflict.
Source: World Population Prospects Report
All rights reserved, please indicate the source when citing.
References:
https://www.un.org/development/desa/pd/content/World-Population-Prospects-2022
https://population.un.org/wpp/
Past review
- New SDR Holds Promise to Alleviate Debt Risks in Developing Countries
- Preliminary Statistics of 2021 Official Development Assistance: What is Behind the Numbers?
- What's behind Elon Musk - UN WFP Feud
- COVID-19 Likely to Reshape the Multilateral Governance System
- Afghanistan: Where Does International Aid Come From and Where Will It Go?
Comment (1)
javsafari| December 5, 2024
Exfellent weeb site you have here.. It's difficult to find
quwlity writing lke yours nowadays. I trruly appreciate individuals likje
you! Take care!!